Since 2007, the Green Party of Canada has experienced a severe decrease in contributions to its EDAs (riding associations), with the losses now totaling more than 80% of both dollars and contributors. The trend has remained negative through 2017.
(This post is the first part of Decade of Decline, my report detailing the collapse of grassroots support for the Green Party of Canada. The remaining parts will be published on this blog over the next few weeks. For a table of contents, please see the Introduction.)
Note to readers: Part 1 of this report is focused on identifying trends and placing them in context. Discussion of the possible consequences, causes, and corrections of these trends is reserved for later Parts of the report.
The decline in dollars raised by Green Party EDAs
Chart 1.1.1 below shows the total dollar amount of contributions received by Green Party EDAs in each year. The total is given both including and excluding the EDA in Saanich—Gulf Islands. (Please see the Introduction for an explanation of how certain outliers are handled in this report.)

Aside from the spike in 2015, the trend is strongly negative since 2007. The total dollar amounts contributed to GPC EDAs in 2016 and 2017 are the lowest on record with Elections Canada (whose records date back to 2004).
Since 2007, the dollar amount of contributions to GPC EDAs has declined by 68%. With Saanich—Gulf Islands excluded, the dollar amount of contributions to all other GPC EDAs has declined by 84%.
The decline in number of contributors to Green Party EDAs
Chart 1.1.2 below shows the total number of contributors to all Green Party EDAs for each year. The total is given both with and without the riding of Saanich—Gulf Islands.

Again, outside of the spike seen in the 2015 election, the trend is strongly negative since 2007. The number of contributors in the years 2016 and 2017 are the lowest on record with Elections Canada (whose records date back to 2004).
Since 2007, the total number of contributors to GPC EDAs has declined by 77%. With Saanich—Gulf Islands excluded, the total number of contributors to all other EDAs has declined by 87%.
Declines in other major parties
By examining data for the Liberals, Conservatives, NDP, and Bloc Québécois, we can compile a list of significant drops in grassroots contributions experienced by other major parties. In every case, these drops correspond with scandals, major election defeats, or internal disarray. The list is as follows, from least damaging to most damaging:
- In the 2011 election, the Liberal party experienced the worst defeat of its long history, falling to third-party status. Leader Michael Ignatieff subsequently resigned. During this period, the dollar amounts contributed to Liberal EDAs declined by 42% and the number of contributors declined by 11%.
- During the period leading up to and during the 2011 election, the Conservative party was at the center of a crisis of democracy. The party made unprecedented use of prorogation; saw its Cabinet found in contempt of Parliament (a first throughout the entire Commonwealth); had charges laid against it by Elections Canada; and was implicated in the robocall scandal. During this period, dollar amounts contributed to Conservative EDAs declined by 16% and the number of contributors declined by 44%.
- In the 2015 election, the NDP suffered a loss of 59 seats (more than half of its seats), falling back to third place. Following the election, a controversy over the party’s direction and leadership led to the unexpected removal of leader Thomas Mulcair. During this time, dollars amounts contributed to NDP EDAs declined by 37% and the number of contributors declined by 49%.
- During the same 2015 election, the Conservative party, having finally achieved majority status in 2011, was soundly defeated by the rival Liberals, after having waged an election campaign that inflamed the anger of centrist and progressive voters across the country. Party leader Stephen Harper, the architect of the party’s past decade of dominance, retired immediately. Following these events, dollar amounts contributed to Conservative EDAs declined by 54% and the number of contributors declined by 41%.
- Leading up to the 2006 election, the Liberal party was implicated in the Sponsorship Scandal. They went on to lose 30 seats in the election, ending 13 consecutive years of Liberal government, and marking the ascendancy of the Conservative party, which lasted for the next decade. Following this election, leader Paul Martin resigned. During this period, dollar amounts contributed to Liberal EDAs declined by 49% and the number of contributors declined by 47%.
None of the declines on this list involves a loss of more than 55% of dollar amounts contributed or 50% of contributors. The Green Party’s losses total 68%/77%, or outside of Saanich—Gulf Islands, 84%/87%.
Despite Canada’s biggest political defeats and scandals of the past 15 years being on this list, the Green Party’s losses since 2007 are between one-and-a-half to three times the magnitude of the losses described above.
The lesson of the Bloc Québécois
However, the list above is incomplete. I have intentionally held back the one example which is similar to the decline of the Green Party in its magnitude and duration. Namely, the ongoing 10-year decline of the Bloc Québécois, which unfolded as follows:
- Starting in 2008, the party went through a period of internal chaos and severe losses. This began when they lost 44 of their 47 seats, and as a result, their official party status. Leader Gilles Duceppe subsequently resigned.
- Their next leader, Daniel Paillé, served for two years, then had to resign for health reasons. He was succeeded by controversial leader Mario Beaulieu, during whose term several Bloc MP’s defected or resigned.
- Duceppe returned for the 2015 election, with Beaulieu remaining as party President. Despite earning ten seats, the party’s popular vote fell to its lowest point ever (19% within Québec), and Duceppe resigned again.
- The term of the next leader, Martine Ouellet, was surrounded by controversy, and the party’s members split into two camps. The struggle culminated in a mass defection of seven of the party’s ten MP’s. A letter signed by more than twenty former Bloc MP’s, including Duceppe, supported the defectors, and Ouellet ultimately resigned in 2018.
- As of August 2018, the Bloc has embarked on a project to completely reinvent itself in time for the 2019 election. However, despite reconciliation efforts and Ouellet’s resignation, five of the seven defectors have not returned. Some party members consider attempting a reinvention program so close to an election “suicide”, and question whether the Bloc will survive the 2019 election. [Edit: as of September 2018, the remaining five defectors have finally returned to the Bloc.]
During the events described above, dollar amounts contributed to Bloc Québécois EDAs dropped by 89% and the number of contributors dropped by 90%. These losses are only 5 and 3 percentage points greater in magnitude than the Green Party’s losses outside of Saanich—Gulf Islands since 2007.
Comparing the Bloc and the Greens
Chart 1.1.3 below compares the decline of dollar amounts contributed to Bloc Québécois and Green Party EDAs. As before, the Green Party statistics are given both with and without Saanich—Gulf Islands. To allow for a clear comparison, the vertical axis shows the amounts contributed as a percentage of each party’s average from 2004-2017 (the full span of Elections Canada data).

The trends are comparable, with the main difference being larger election spikes for the Green Party, particularly in 2015.
Chart 1.1.4 below compares the decline in the number of contributors to Bloc Québécois and Green Party EDAs. Again, to allow for easy comparison, each party’s number of contributors is given as a percentage of that party’s average from 2004-2017.

As with Chart 1.1.3, the trends are similar in both duration and magnitude, with the Green Party experiencing a larger spike in the 2015 election.
Upward trends in major parties
We have compared the Green Party’s decline to the most serious declines in other parties. But what about upward trends?
In the 15 years of data available, there are only two significant upward trends in other major parties:
- From the year 2004 to 2011, the new Conservative party was formed with Stephen Harper as its leader, and won consecutive elections in 2006, 2008, and 2011. During this period, the Conservatives increased the dollar amounts contributed to their EDAs by 118% and the number of contributors also by 118%. (This is equivalent to recovering from a loss of 54% of both dollar amounts and contributors.)
- In 2013, Justin Trudeau was elected leader of the Liberal Party, and led them to a historic comeback from third place to majority government. During this time, the Liberals increased the dollar amounts contributed to their EDAs by 156% and the number of contributors by 38%. (This is equivalent to recovering from a loss of 61% of dollars and 28% of contributors.)
In other words, to reverse the Green Party’s decline of EDA-level contributions would require an event of greater impact than Justin Trudeau’s Liberal revival or Stephen Harper’s decade of Conservative dominance.
Another important point to consider when looking at the list of declines and upward trends is that, in Canadian federal politics, serious declines appear to be more numerous and happen more quickly than growth. Building a federal party is a slow process and invariably involves setbacks.
The Liberal revival is the only example in the past 15 years of a party making such a rapid recovery, and it was achieved by a party with an extremely long history and well-established support base. (And, again, it would take an event with almost double the impact of this Liberal revival to fully recover the Green Party’s losses since 2007.)
Normal fluctuations in major parties
Having examined declines and upward trends, we can round out the picture by making some general observations about EDA contributions outside of these periods.
For the three major parties, outside of the crisis and growth periods listed above, no decrease in EDA contributions has lasted longer than two years, nor involved a loss of more than 25% of the party’s average contributions.
Phrased another way, the decline of the Green Party is five times longer in duration, and three-to-four times deeper in its effects, than any normal up-and-down fluctuations that major parties usually experience.
A final perspective: the Green share of the pie
We have already examined Green Party EDA contributions over time, compared them to the declines and growth periods of other major parties, and compared them in detail with the misfortunes of the Bloc Québécois.
Chart 1.1.5 presents one final perspective, which is the Green Party’s percentage share of dollars contributed to EDAs of the five major parties. This perspective compensates for election-year spikes (when all parties typically raise more money), longer-term political trends (such as a shift toward or away from EDA’s as a fundraising tool), and currency inflation, allowing us to measure party-vs-party performance.
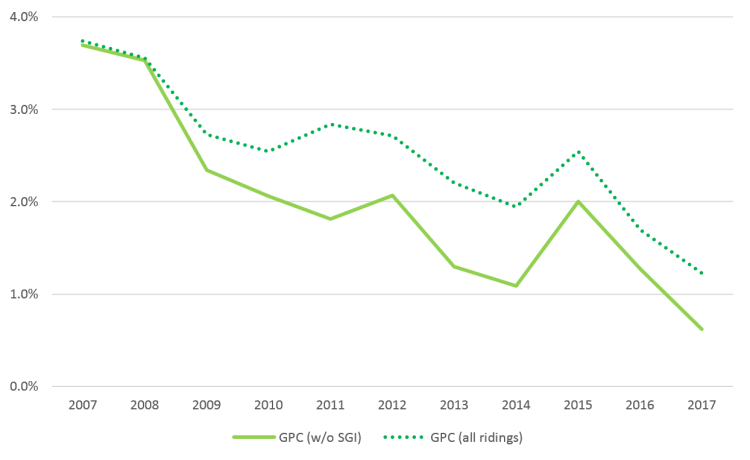
We can see that a bump is still present in 2015, indicating that although all parties experienced historic dollar amounts contributed to their EDAs that year, the Green Party increased its amounts contributed more than the other parties did.
However, that is the only bright spot on the chart. The downward trend from 2007 to 2017 is unmistakable and relentless. The Green Party began the decade with its EDAs receiving 3.7% of all dollars contributed to EDAs of the five major parties. It ended the decade capturing only 1.2% of those dollars, a drop of two thirds. Outside of Saanich—Gulf Islands it captured only 0.6% of those dollars, a drop of five-sixths.
Chart 1.1.6 applies the same lens to EDA contributors. The chart shows the number of contributors to Green Party EDAs each year as a percentage of the total number of contributors to EDAs of the five major parties.

Again, 2015 is a bright spot. With the EDA in Saanich—Gulf Islands included, it was the party’s best year relative to the performance of other parties. With the EDA in Saanich—Gulf Islands excluded, it was the party’s third-best year, closely behind 2007 and 2008.
However, there is the same unmistakable downward trend. The Green Party began the decade with 5.9% of all contributors to major party EDAs in 2008.
That percentage rose to 6.4% in 2009 if the EDA in Saanich—Gulf Islands is included, but had already fallen to 4.6% if SGI is excluded.
By 2017 only 1.5% of contributors to major party EDAs were contributing to the GPC, a drop of three-quarters since 2009. Excluding Saanich—Gulf Islands, the percentage was even lower at 0.9%, a drop of four-fifths since 2008.
Summary
Since 2007, the Green Party has experienced a deep and prolonged decline in EDA contributions, with losses between 68–87%. This decline is visible in the absolute number of dollars and contributors, and also relative to the performance of other parties. Outside the single outlier riding of Saanich—Gulf Islands, the Green Party’s decline is even more profound, and involves a loss of more than 80% of both dollars and contributors.
No major party has undergone a decline more than half as severe in the past 15 years, with the exception of the Bloc Québécois. The decline in the Bloc is similar in both duration and depth, and has culminated in an existential crisis for that party, with some observers suggesting the Bloc may not survive the 2019 election.
A comeback proportional to the one the Liberals achieved leading up to the 2015 election—widely seen as one of the greatest comebacks in Canadian political history—would serve to recover only half of the losses experienced by the Green Party over the past decade.
The downward trend has continued through 2017, with the years 2016-17 being the worst on record with Elections Canada.
Coming next
Part 1.2 has been published. It examines the declining number of active EDAs, the increase of “paper EDAs”, and the erosion of the party’s core of well-established EDAs.
Each part of the report will be published on this blog, at a rate of one or two parts per week. To be informed when new parts are published, you can follow this blog, or contact me and I will inform you personally.
[Edit 2018-Sep-11: Several changes were made to improve this post. All charts and comparisons were adjusted to begin with 2007 instead of 2008, so that the window of comparison would both begin and end on a non-election year. (This did not impact any of the post’s overall conclusions.) Charts 1.1.5 and 1.1.6 were added to provide an additional perspective on the fundraising decline. Wording was improved in several places to be more clear and more specific, without changing the meaning of the text or the claims being made.]
[Edit 2018-Sep-24: Additional improvements were made. Terminology was standardized to “dollar amounts contributed” and “number of contributors” for clarity. Captions were added to all graphs. The data set was upgraded to correct errors that GPC EDAs had made when filing their financial statements. None of these improvements affected the overall conclusions of this post.]
[Edit 2018-Sep-26: Changed title from “collapse of local fundraising” to “collapse of local contributions” for better accuracy.]

As usual Saul, interesting info. What are the factors and the prescription?
LikeLike
Excellent Saul – thank you so much for detailed analysis. Looking forward to the rest.
LikeLike
Thanks Bruce.
In later parts of the report, I attempt to answer both of those questions. I don’t want to comment in too much detail yet, because I am still verifying some finer points. But speaking generally, a recovery would require fundamental changes to how money is raised, distributed, and spent — in other words, a rethink of the party’s financing model. The parts of the report covering these suggestions should be published in about two weeks (there are some other parts coming in between).
LikeLike
Thank you Sharon! 🙂
LikeLike
Despite the writing on the wall we are putting people in parliament and provincial politics.
LikeLike
Hi Ann, the last few years have indeed gone well for several of the provincial Green parties.
These statistics relate to the federal party only, and at that level progress has been stalled. With only one MP, and coming off its lowest popular vote result in 15 years, the writing on the wall starts to seem more relevant.
LikeLike
Your analysis is fatally flawed. Although you discount the 2015 election spike as being due to an election, you start all your graphs at 2008, which was during another election. If you were to follow your own advice, you would start your graph outside of election years, such as 2007, or (as per your implicit criticism of leadership under Elizabeth May), start when the leader was first elected to her post, in 2006. The result of starting on a high spike year exaggerates or creates a downward “trend” that would fade if you chose a fair starting point. You are doing the exact same thing as the climate deniers who used the hot peak year 1998 as their starting point to facetiously argue that the Earth was in a “cooling trend”.
You also have completely ignored national direct fundraising, which the party has chosen to focus upon. If you included it, you’d see a steady upward trend for pretty much the entire period. This indicates that the party has chosen to prioritize brand-based (national) rather than community-based (local) fundraising. While you may assert that this was the wrong choice, we really have no way to prove it either way, since the other option wasn’t taken and thus can’t be measured. However, as far as I can tell, all of the more electorally-successful parties have also chosen the national brand over local promotion, so you can’t say that it is a universally poor strategy, since it has worked just fine for them.
Until you adjust your start year and account for rising national donations, your post provides no genuinely useful analysis.
LikeLike
I’m afraid your conclusion is completely undermined by your choice of starting date in 2008. Of course, 2008 was a major election year, with Elizabeth in the televised leader’s debate, so it was a fundraising high point. Also, there was a lengthy and hotly-contested by-election in Guelph that we were tracking to win until the general election was called on the last day, cancelling the by-election. I know there was a very large amount of local fundraising for that event. By choosing this high point as your starting point, you exaggerate or even create a spurious “downward trend”. This is exactly the same tactic used by climate deniers to create a spurious “cooling trend” by using the record-breaking hot year 1998 as their starting point. This is especially egregious as you yourself are trying to exclude the 2015 election year high point from your “trend”. Why do you not treat 2008 the same way? If you did, you’d see that rather than a long-term downward trend, there is instead a 2-phase system: high in election years, low in years between.
For this to have any validity you would have to pick a non-election period like, say, 2007, or better yet, 2006, when Elizabeth May was elected leader, since your whole series is tacitly critiquing her leadership.
As it is, your graphs are misleading and your trend is essentially fabricated.
LikeLike
The other problem with your analysis is that you are implicitly assuming that EDA-level fundraising is the most important factor, while ignoring entirely the steady rise in national fundraising that has taken place over the past decade-plus.
The GPC has apparently chosen to focus more on direct contact and fundraising rather than expoanding EDA-level fundraising. Whether or not you feel this is a good thing, the result has been a rise in total fundraising. And you can’t blame that strategy for vote loss, because from what I can see, ALL of the national parties have taken this same tack – including the ones who have increased their vote share and seats. So it’s not like going national instead of local is automatically a bad thing.
The final factor you leave out is the per-vote subsidy which was in place from 2004 – 2015. The GPC, unlike any other party, transferred a significant amount of this funding directly to EDAs. That quarterly income quite possibly reduced the drive for many EDAs to even do serious local fundraising, because they already had a steady (if modest) source of funding coming through the party. The decision to share out this funding was made by the party members and ratified by the EDAs, before May was elected leader, so you can’t blame that on her or the party administration for the past decade. Unless you factor in that influence somehow, your analysis remains lacking on key points.
LikeLike
[Edit: corrected to instances of “2018” to “2008”; thanks ericthegreen for spotting this.]
Hi ericthegreen, thank you for your comments.
The starting year of 2008 was not chosen arbitrarily, nor was it chosen to maximize the magnitude of the decline. Keep in mind that this is only the first part of a report that is based on many statistics, not just the fundraising totals seen in chart 1.1.1. Some of these statistics have no correlation to the election cycle, and even the ones that are directly related to the election cycle do not all peak in 2008. In choosing the start year of 2008, my purpose was simply to pick the year which was most representative of the start of the decline.
However, to provide readers with better context, and to avoid any perception of unfairness toward the GPC, I have decided to adjust the charts and statistics in this section to start in 2007. Although this start year is more favorable to the party for some statistics, it is actually less favorable for others. On the whole, adjusting the start year to 2007 does not change the conclusion of Part 1.1, which is that the party has undergone a profound and prolonged downward trend in its local fundraising.
As for central party fundraising, no, I have not ignored it. Please keep in mind that this report is divided into sections and is being published serially. The purpose of Part 1.1 is specifically to identify the trends at the EDA level, and to put their duration and magnitude into the larger context of the public data available for 2004-2017. It is not the job of Part 1.1 to examine strategies, decisions, causes, or consequences. Later sections of the report will examine the relationship between central party fundraising and EDA fundraising in detail, the potential causes of lost EDA fundraising, and the potential consequences.
Those sections will be published in the coming weeks. Thank you for your patience as I work to polish those sections so they are ready for publication.
LikeLike
Hi erichthegreen, there is some overlap between this comment and your other one. I will address only those points which I have not already addressed in my other reply.
First off, please consider that this blog is a publicly visible space. In claiming that I have “fabricated” a trend, you are making a serious accusation about my honesty and integrity. In future, you may want to confirm that such an accusation is correct before you contribute it to the public record.
As you can see by reviewing the updated post, your accusation is false. With an adjusted start date of 2007, the downward trend experienced by the GPC is still longer and more profound than any decline experienced by another major party in the years 2004-2017, with the exception of the decline of the Bloc Québécois. The change of start date has not affected this conclusion.
For an alternative visualization of this trend which may be of use to you, I have added charts 1.1.5 and 1.1.6, which examine the GPC’s fundraising as a percentage of total fundraising by the major parties. This visualization compensates for election-year spikes, long-term trends in political strategy, and currency inflation. As you can see in charts 1.1.5 and 1.1.6, the downward trend is very clear.
If you would like to retract your accusation that I have fabricated the decline in local fundraising by cherry-picking the starting year of my comparison, I would be happy to accept your retraction here.
LikeLike
Hi again erichthegreen, thank you for your further comments.
I would like to remind you again that this is a multi-part report which is being published serially. Each part of the report deals with a specific subject. For Part 1.1, the focus is strictly on identifying the trend in EDA-level fundraising, and placing it into the larger context of public data for 2004-2017.
The other topics you mention were not omitted from Part 1.1 by accident or oversight. In fact, all of them are covered in detail in later sections of the report, to be published in the coming weeks.
Rather than discussing those topics now, or jumping the gun on analysis of the trends I am identifying, I will wait until the later sections are published so that the discussion can be fully informed. Thank you for your patience.
LikeLike
I’m not going to retract what I said, but I will say that it is not “an accusation”. I said “essentially fabricated”, but I will qualify that by noting that it is possible that this was unintentional on your part, which is why I will continue to suggest alternative interpretations for this data that I feel are more accurate. So for clarity, I am “accusing” only erroneous analysis (an opinion), not deliberate deception (malice).
By adding 2007, it significantly reduces the scale of the “decline”, as I had predicted. I suggest that by going back even further – starting, say, in 2003, 3 years before the current leader’s term began, would reduce it even more (or turn it into a rise). Why not do so, to allow others to judge fairly if you have found a real trend or just an apparent one?
In the meantime, by adding 2007, it becomes even clearer that there is a definitie spike in election years and a trough between. You could certainly argue that the between-election lows are lower (although only barely) than similar periods 2012-2014 or 2009-2010. I would not look at 2007 as an indication because, as is readily apparent, the spike around an election is almost symmetrical, especially when you look at the 2015 spike, where 2014 = 2016 and 2013 = 2017 (almost). Something you don’t take into consideration, though, is that the years 2004 – 2011 were minority governments when elections were always looming, so candidates tended to be nominated earlier or stay active between elections (as did EDAs), hence fundraising and other local activity was a relative constant. Another very important factor is that, before 2011, Elizabeth May was not an MP and thus had about 4 times as much time to visit EDAs for local fundraising events, something she did at low or no cost with a more generous fundraising split to the local level than ANY other elected party offers. Since she has become an MP, she has been far less available to support local fundraising BUT far more effective nationally and in SGI.
What your analysis totally ignores, and I feel it is another fatal flaw, is the vast difference in character of local fundraising between a period of minority government with frequent (about every 2 years) elections of 2004-2011 and the following period of fixed-date, 4-year election cycle (2011 – present). Given that local activity has always been strongly election-driven, the former period will naturally have a higher average fundraising in non-election years, although you’ll also note it is a much flatter period, with lower election peaks. On the other hand, in the 4-year fixed cycle, fundraising will tend to bottom-out in the middle of the cycle, but peak at the election year, in a far more spiky way.
Of course, 2011 is a hinge year – the preceding years were uncertain (hence flat), while the following years began the newer, spikier, high-low 4-year cycle. That’s why 2011 is not a symmetrical peak.
Nevertheless, I feel confident in saying that there is not an actual downward trend. Instead, what you have demonstrated is that election years have higher local fundraising than non-election years, but an extended period of minority government has a much flatter line, while a stable 4-year cycle has a lower bottom bound but a (much!) higher upper bound, and if you average those out, you would see that the total (thus average) fundraising of the later 5-year period (2013-2017) is HIGHER than the total/average for the earlier 5-year period (2008-2012).
So at this point I am going to re-iterate that the downward trend is fabricated. It can only be sustained by two misinterpretations, which I will assume were honest mistakes on your part:
1) You are ignoring the huge difference in local activity (including fundraising) between a minority government, uncertain term, rapid-fire election period and a stable, 4-year, fixed-date period. Having been active at the local level in my own EDA, and a mentor for others, in both periods, I can say that they are very different and can’t be compared like apples to apples.
2) You are arguing to exclude the 2015 fundraising peak and act like the off years are the “norm”. There is zero justification for this. The primary purpose of an EDA is to prepare for an election and then support the candidate during the election. To eliminate or even discount the most important year of this cycle (the election year) is to make your analysis essentially worthless.
In summary, what you are actually arguing is that the flatter fundraising curve under short-term minority governments is “better” or more natural, while the spiky pattern under stable 4-year majories is worse (even though the total/average income is *more*). And let me tell you, as someone who’s extensively worked the local level in both cycles, the former is FAR more stressful and wearing on candidates, volunteers, and EDA executive than the latter. Are EDAs less active between elections now than they were then? Yes. Is that a bad thing, or does it indicate a decline in the party’s support? Well, that’s something that most definitely isn’t backed by the charts you have presented here.
LikeLike
I will wait for the other parts but having now looked very closely at this first part, I must say I’m not optimistic. I feel that I have thoroughly, in the previous reply, refuted your “downward trend”. Specifically, I believe your charts show that the total local fundraising of the 2nd 5-year period (2013 – 2017) is HIGHER, than the previous 5-year period (2008 – 2012).
Your charts are hard to read for exact numbers and you don’t seem to have posted your full data, but my best guesses give a total of $1,550,000 for the earlier period and $1,650,000 for the later. I could be off in either or both numbers, feel free to post the actual totals for those periods; the actual numbers may be closer to each other or even the same. But I am pretty confident that the 2nd half is not lower than the first half, so there is no “downward trend” (unless you unreasonably exclude the 2015 election peak).
I also disagree with your exclusion of SGI’s numbers but I’ll leave that argument for another comment, if you really want to have it.
LikeLike
I cannot reconcile your two statements here. First you say “The starting year of 2018 was not chosen arbitrarily, nor was it chosen to maximize the magnitude of the decline.” (I assume you meant to type 2008).
Then you say “In choosing the start year of 2018, my purpose was simply to pick the year which was most representative of the start of the decline.” (Again, I assume you meant 2008).
To me that second statement explicitly says you chose that year as the peak from which your “decline” began, or the point from which your “decline” would be most noticeable, hence maximized.
Perhaps you mean 2008 was an average year for the pre-decline period? If so, then you should look at my comment below about the apples-to-oranges comparison of minority cycle activity with stable majority 4-year cycle activity. To do that without acknowledging it, then to further compound the error by comparing only troughs while setting aside election peaks (in the latter period, only) is to compare apples to peas.
I will certainly agree that there has been a sea change in how both the local units and central party raise funds, organize, and do just about everything else between those two very different environments. But I would attribute that change largely to the shift from unstable minority frequent election environment to the stable majorities, plus the election of our leader to Parliament, as the primary reasons, and not some kind of non-existent “decline”.
LikeLike
Saul, how have you accounted for directed donations in your analysis?
LikeLike
Thanks Dave, excellent question!
Elections Canada financial reporting does not recognize the concept of a directed donation; there are only contributions and transfers. So, when using public data, depending on the type of directed donation we are talking about, there are different ways we can go about trying to detect and measure it.
Type 1: A person in riding A makes a contribution to a riding association in riding B. If their contribution is large enough, their name and address will have been recorded, and we can use this to flag the contribution as being between ridings. (The obvious example here would be people from across the country contributing to the riding association in the leader’s riding to help get the leader elected.) If their contribution is smaller and no address is recorded, there is no way to detect that it has come from another riding using only the public data.
Type 2: A person contributes to the central party, but asks that the contribution be given to a certain riding association. This would show up in the financial reporting as a contribution to the central party, and a transfer from the central party to the riding association. There is no way to tell, from the public data alone, which transfers are from directed contributions, which are from revenue-sharing systems, and which are funding for “target” ridings. (This information may exist as part of the party’s private records.) However, it may be possible to infer the type of transfer, based on the amount and timing. (For example, a lump-sum transfer of exactly $50,000 from the central party to a riding association in an election year is likely funding for a “target” riding, since a single individual cannot contribute $50,000.) As of today, the GPC website donation page does not offer the option of redirecting a contribution to an EDA. I am not aware of whether such an option existed in the past.
This specific chapter of the report deals with the sum of all EDA contributions received, so directing a contribution from one riding to another would not affect these particular totals. However, a later chapter on the subject of regionalization uses the factors mentioned above to make a rough determination of the flows of money that exist between and within regions.
LikeLike
Hi erichthegreen, sorry it has taken me so long to reply. I appreciate your detailed comments. (Note: My blog software appears to only allow replies 3 levels deep, so I am replying to all of your unanswered comments here in a single reply.)
First off, I think we need to be clear about how trends are identified. Let’s say we were talking about the 2008 financial crisis, and I made the comment that “From October 2007 to March 2009, the Down Jones dropped from 14000 to 6600”. You wouldn’t ask me to change the start date of my comparison to 1994, and thus show an increase from 6200 to 6600. If we changed the window in that way, we would no longer be talking about the 2008 financial crisis.
Similarly, the subject of this report is the various downward trends in the GPC that begin in the years 2007-2009, and continue through 2017. One could just as easily write a report that start in 1984 and shows how the GPC went from a fringe party to a major party — or write a report that is restricted to 2015 and shows how it was a record year for the GPC. But those would be different reports on different topics. I am writing about this decade and its trajectory has been downward.
I will also clarify my comment about 2008 being “most representative” of the start of the decline. The overall decline examined by this report is made up of many different variables that have all trended in a negative direction. 2008 is the year that the greatest number of these variables began their negative trend. Other variables went negative in 2007 or 2009 or even a few in 2010. As far as maximizing the apparent decline is concerned, 2008 is certainly the “worst-looking” comparison year for some variables, but for others it’s not. This is how you can reconcile my statement that I did not seek to “maximize” the downward trend, but rather, pick the starting year which was “most representative” of when the largest number of variables began their decline.
I hope this clarifies the selection of the start date and the scope of the report. I will reply to your other points in a second comment.
LikeLike
Hi erichthegreen, regarding your comments about minority / majority environments, this is an interesting theory, but the totals for your two suggested 5-year periods tell the opposite story.
For the period 2008-2012, total EDA contributions to the GPC were $1.87M, and to the other major parties, $62.14M.
For the period 2013-2017, total EDA contributions to the GPC were $1.69M, and to the other major parties, $77.48M.
So, while other parties saw a rise of 25% in EDA contributions with the transition to majority governments, the GPC saw a decline of 10%. This pretty clearly shows that the GPC is out of step with the other parties, and confirms the downward trend.
(Regarding posting my full data, the source data is of course publicly available on the Elections Canada website. When the complete report has been published, I will look at potentially adding an appendix showing intermediate calculations and data tables that may be of interest to readers.)
LikeLike
(In case my blog does not notify you of my replies below, I am posting here. Please see my most recent comments at the bottom for replies to all of your unanswered points. Thanks!)
LikeLike
Hi erichthegreen, I think I have now addressed all of your questions and theories, except those which will be covered by later chapters of the report (all of which I have noted in my replies). If there is anything you feel I’ve missed, please let me know.
Having examined the data in various other ways at your request, and given that all of those alternate views confirm the downward trend I had originally identified, I wonder whether you still feel there is any aspect of this report which is “fabricated”? If so, I would be interested to know what that might be. Thanks again for your comments.
LikeLike