
The Liberal Party of Canada will elect a new leader on March 9. Usually, a party leadership election is something that happens when the party is out of power and reinventing itself, and is an event that mostly interests the party’s core supporters.
This time, however, the stakes are much higher. The winner will become Prime Minister during a period of national crisis. Only a few weeks later, they will face a confidence vote in Parliament and almost certainly lose that vote, triggering a general election. Based on recent polling, that election could lead to a number of possible majority, minority, or coalition governments with different policy priorities.
In other words, the outcome of this leadership race could have a much more immediate effect on the lives of people in Canada than the typical rebranding exercise, and people have good reason to want to know who is likely to win.
So far, mainstream media and pundits have widely presented the contest as a two-way race between Mark Carney and Chrystia Freeland, with Carney as the front-runner.
Recent polling appears to agree. For example, a February 7-23 poll by Mainstreet Research shows 43% of registered Liberals preferring Carney, 31% Freeland, 16% Karina Gould, 3% Frank Baylis, and the remaining 7% undecided.
However, I’m not convinced.
In past leadership races that I’ve analyzed, the strongest predictor of the final vote has not been polling, endorsements, or past governing experience, but rather, the number of donations that each candidate receives during the leadership campaign.
(For example, see my two published leadership projections, for the Green Party races electing Annamie Paul in 2020 and Elizabeth May in 2022. Donation data correctly predicted not only the winner of these contests, but also the final vote within a few percentage points, the total number of rounds of voting, and even the order of elimination of some lower-placed candidates.)
What do donation numbers tell us about the Liberal race?
The first set of campaign financial returns, covering donations through to February 9, were published by Elections Canada on February 18. These returns tell a much more one-sided story.
Here are the donation totals for each candidate:
| Donors | % of all donors | |
|---|---|---|
| Baylis | 188 | 1.4% |
| Carney | 11260 | 85.6% |
| Freeland | 332 | 2.5% |
| Gould | 1375 | 10.5% |
If we project the outcome directly from this data, we would expect Carney to win on the first ballot with a dominating 85.6% of votes, while Gould–not Freeland!–would place second, with 10.5%.
However, there’s a problem with this data that we need to address. While most of the campaigns reported their donations through to February 5, the Freeland campaign only submitted data through to January 29. This means that her donation totals are understated. The question is, by how much?
Estimating Freeland’s donation numbers
This CBC news story from February 18, the day the Elections Canada data was published, includes quotes from the Freeland and Gould campaigns regarding their fundraising:
- Freeland’s campaign confirmed to CBC that their financial return was incomplete, and stated that they have raised “nearly $600,000” from a total of “over 2,000” donors.
- Gould’s campaign, meanwhile, made a public announcement the same day, stating that they had received contributions from “over 3,000” donors.
It’s safe to assume that in the quotes above, the campaigns would have stated their most recent totals (presumably of February 17 or 18), rather than providing numbers from some arbitrary earlier date.
If we want to make a reliable projection, we need an apples-to-apples comparison that uses the same date for every candidate. Using linear interpolation, we can estimate that as of February 5, Freeland would have had around 933 donors. Our projection would now look like this:
| Donors | % of Donors | |
|---|---|---|
| Baylis | 188 | 1.4% |
| Carney | 11260 | 81.9% |
| Freeland | 933 | 6.8% |
| Gould | 1375 | 10.0% |
That didn’t change much, did it? Freeland is still in third behind Gould, and Carney is still winning by a landslide in the first round.
In other words, we still have two contradictory projections for the outcome of this race. The donation numbers point to a Carney landslide with Gould in second, while the Mainstreet poll and general pundit consensus suggests Carney in first, Freeland in second, and nobody with enough support to win on the first ballot.
I’ve already claimed that the donation data is more reliable. But why is that? And why should you trust donation numbers ahead of polling and pundits?
What wins leadership races?
Take a look at the following chart, which shows how many donations each candidate had accumulated on a day-by-day basis (tap or click to enlarge):
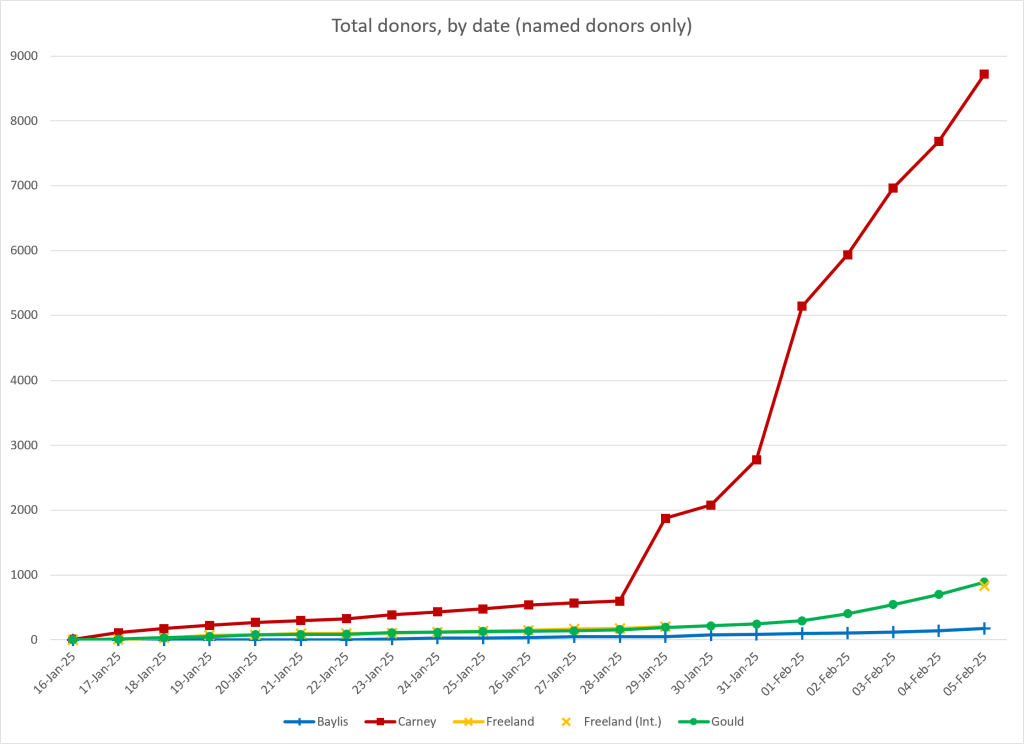
What happened on January 29? Why the sudden, massive jump in Carney’s donations–nearly quadrupling overnight–and the sustained growth from then onward? If you’d like a second clue, take a look at this chart, which tracks the average donation amount for each candidate as it changes day-by-day (tap or click to enlarge):

Again, something funny is happening on January 29—Carney’s average donation drops drastically, from about $1000/donor to $400/donor.
What would cause the number of donations to jump drastically, while the average donation amount drops, both on the same day?
Okay, enough suspense! If we refer to the Liberal Party Leadership Expense Rules, we can see in Rule 2.1.1(ii) that candidates must pay a fee of $50,000, no later than January 30, to gain access to the party’s membership list.
In a leadership contest, the membership list is invaluable. It allows a campaign to do mass outreach via text, email, or phone, reaching exponentially more voters than they could ever reach through one-at-a-time local events or through the candidate’s personal network of contacts.
Turnout for party leadership races is actually quite low—often below 50%. Despite all the attention that’s paid to debates, news coverage, and social media, these are not strong motivators for the average member to vote. Direct contact is what creates the emotional commitment and follow-through. As a result, leadership races are primarily won or lost based on how effectively a campaign can exploit the membership list.
This is also why donations are a good predictor of votes. The same outreach that motivates a person to donate partway through the campaign is usually what motivates them to vote (and reminds them to vote) when the time comes. So by counting donations, we’re actually measuring outreach performance, which also determines votes.
Returning to the charts, what we’re seeing on January 29 is almost certainly the Carney campaign’s first mass outreach after gaining access to the list. The huge payoff is not just a reflection of his appeal to Liberal members, but also an indication that he has an extremely well-organized campaign team.
What about the other candidates? Remember, the rules state that all candidates must pay the $50,000 fee by January 30. As of that date, all of them had access to the membership list. Therefore, what we see in the chart above is what those campaigns were able to achieve with the same list as the Carney campaign received.
Gould’s donations accelerated modestly. Some time around February 5, her total would have surpassed the projected number for Freeland (which is indicated on the chart with an X), on the way to outpacing Freeland appromixately 3000 to 2000 by February 18.
Altogether, these numbers suggest that Mark Carney’s campaign team is vastly outpacing the other candidates in its ability to connect with members using the membership list, so much so that a landslide victory is likely. Gould, meanwhile, has overtaken Freeland since gaining access to the list.
Why would other indicators be wrong?
I’ve made my case for donation data being a reliable indicator of votes, but that doesn’t explain why other indicators might be wrong. It would be more satisfying if we had a theory for that as well.
Let’s start with polling. As I said earlier, there is nothing wrong with the Mainstreet Research poll I mentioned. It was targeted specifically to Liberal party members (not Liberal voters or the general public), had a good sample size with 2400 respondents, and was conducted once the race was properly underway.
The problem is, measuring sentiments is not the same as measuring actions. The 2400 respondents in this poll all expressed an opinion, but not all of them will act on that opinion. Many of them won’t, unless they’re contacted, motivated, and reminded by a campaign team.
To put it another way, a leadership candidate’s polling support is more like a ceiling. Most candidates don’t reach this ceiling, but they’ll end up closer to it or further from it based on the effectiveness of their outreach. Here’s an example of how this could play out in the current race:
| Candidate | Poll % | # Supporters | # Reached | Vote % |
|---|---|---|---|---|
| Carney | 43% | 1032 | 820 | 82% |
| Freeland | 31% | 744 | 70 | 7% |
| Gould | 16% | 384 | 100 | 10% |
Or, if you prefer a real-world example, consider the previous Liberal party leadership race. Justin Trudeau had polling support of 60-63% among Liberal members, but secured 78% of the final vote.
As for caucus endorsements, I’m not convinced these are a useful indicator. There are too many competing reasons why an MP might choose to endorse a leadership candidate, for example:
- Out of personal loyalty or friendship
- To align themselves with the person they expect will win
- Based on the person’s effectiveness behind closed doors (something members cannot see or evaluate)
- To position their own brand by showing which policies they align for/against
Many of these factors simply aren’t relevant to an average party member. In fact, if we compare caucus endorsements to polling, we can see that they aren’t aligned:
| Candidate | # Endorsements | % Endorsements | Poll % |
|---|---|---|---|
| Carney | 68 | 70% | 43% |
| Freeland | 27 | 28% | 31% |
| Gould | 2 | 2% | 16% |
I haven’t seen any convincing evidence that caucus endorsements drive voting behaviour in a leadership contest. Given that they disagree with member polling, and given all the competing motivations that can factor into an endorsement, I don’t think they’re a useful indicator for predicting the outcome of the race.
What’s next?
The campaigns will submit their second financial returns on March 7. These returns will contain donation data through to March 2, allowing for a more detailed and confident projection.
However, with what we already know, I’m comfortable calling it: Carney will win the first ballot in a landslide.

Leave a comment