Since 2007, the Green Party of Canada has experienced an ongoing decline in the number of active EDAs (riding associations), and an erosion of the party’s core of long-established EDAs.
(This post is the second part of Decade of Decline, my 2018 report detailing the collapse of grassroots support for the Green Party of Canada. For a table of contents, please see the Introduction.)
(Update 2021: Greens Fail to Nominate Full Slate; up to $1,000,000 of Public Funding at Risk)
(Update 2022: The Green Party of Canada has lost 11,000 Members)
(Update 2025: The Green Party of Canada is Dead—And That’s Okay)
Failure to increase the total number of EDAs
Chart 1.2.1 below shows the percentage of ridings in Canada where a Green Party EDA filed a financial return. (In 2015, the number of federal ridings in Canada was increased from 308 to 338.)
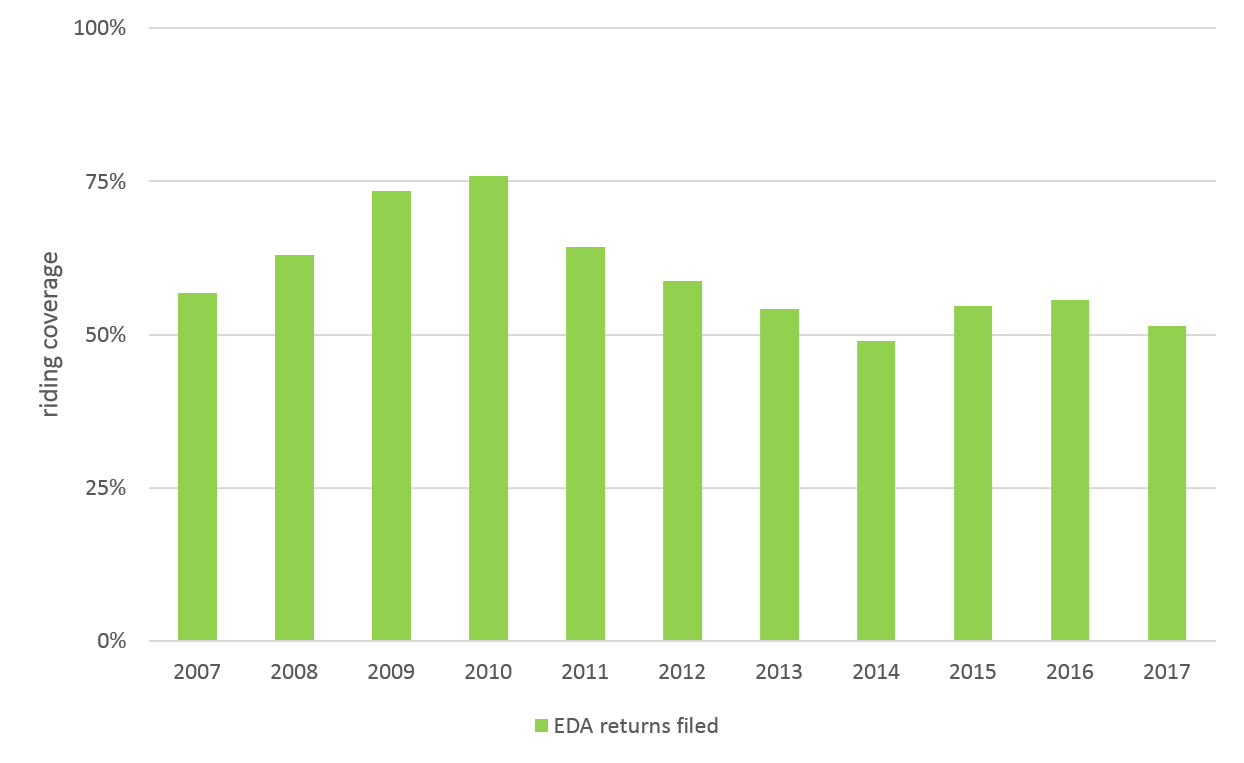
In 2007, there were Green Party EDAs in 57% of ridings across Canada. Over the next four years, a period of growth led to a peak in 2010, when 76% of ridings in Canada had a Green Party EDA. This was followed by a decline that erased these gains and more, leaving only 49% of ridings with a Green Party EDA in 2014.
Following this rise and fall, the number of EDAs has remained stagnant, with 51% of ridings having a Green Party EDA in 2017. The overall change from 2007 to 2017 is a loss of 5–6 percentage points.
By comparison, from 2007 to 2017, the Liberals, Conservatives, and NDP have maintained EDAs in nearly every riding across Canada, with only 1–3 ridings lacking an EDA in any given year. (The Bloc Québécois only strives to establish EDAs in Québec ridings, so is not a useful comparison here.)
The increasing proportion of paper EDAs
The previous section might create the perception that, although the GPC is not making gains, it is at least holding on to a core of existing, healthy EDAs. However, this perception turns out to be false in several ways.
It’s important to understand that the advantage of an EDA is to empower local members financially. No EDA is needed for a group of members to meet regularly, share ideas, organize activities, or plan for future elections. What an EDA facilitates is local-level fundraising, spending, and accounting—a pool of money that belongs to that riding and is governed by local members. An EDA that is financially inactive is therefore little more than an administrative burden on local members, and this is where we come to the issue of “paper EDAs”.
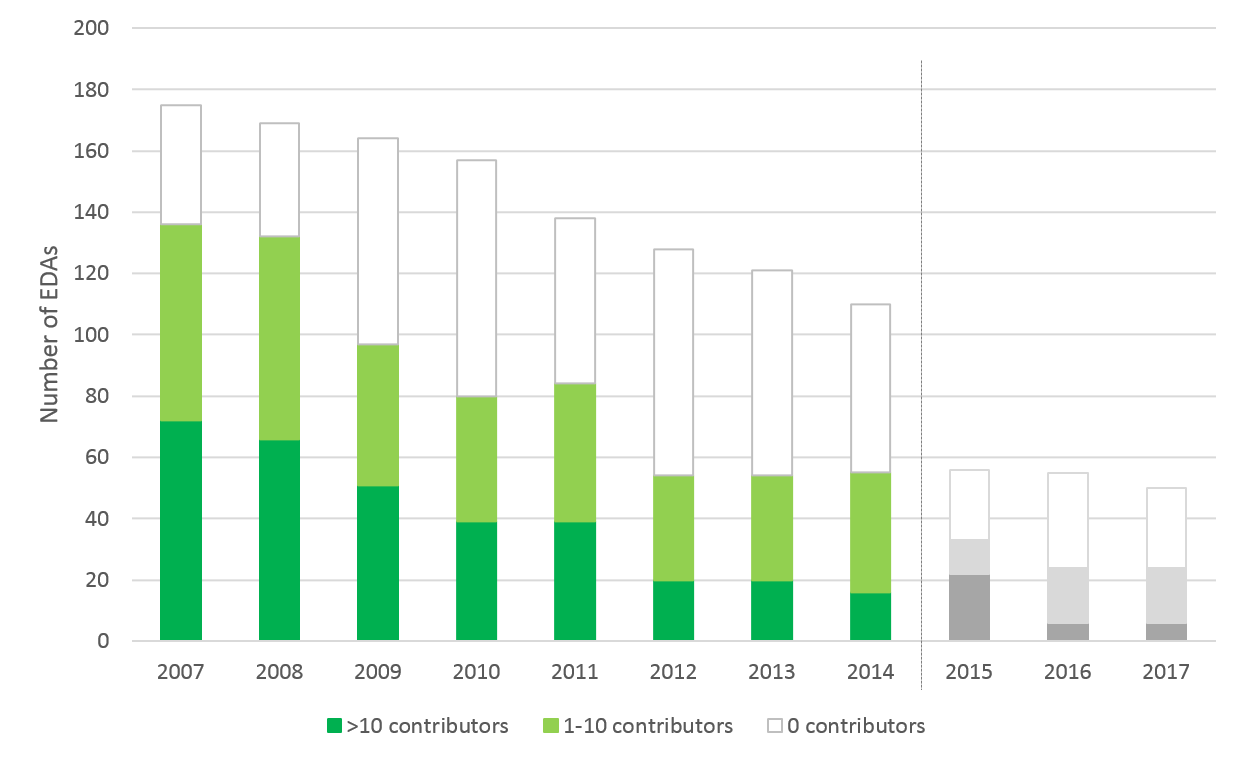
Chart 1.2.2 below shows the number of Green Party EDAs, broken down according to the number of contributors per year: none, 1–10, or more than ten.
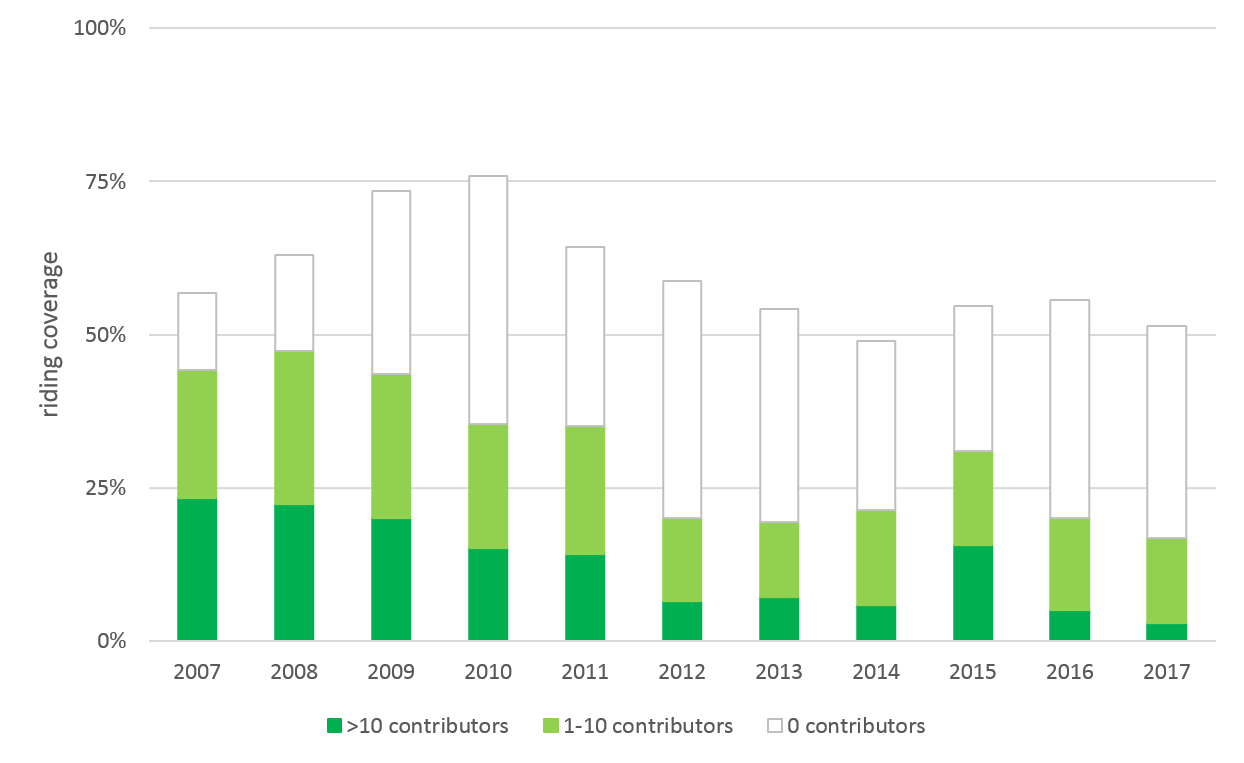
The percentage of ridings with a Green Party EDA with at least one contributor has declined from 44% of ridings in 2007 to only 17% of ridings in 2017, a loss of more than half of the party’s financially active EDAs.
Focusing on EDAs with more than 10 contributors (the dark green portion of the bars in Chart 1.2.2), the decline has been deeper, from 23% of ridings in 2007 to only 3% of ridings in 2017, a loss of almost seven eighths.
The remaining EDAs in each year (the white portion of the bars in Chart 1.2.2) had no contributors at all. These “paper EDAs” make the overall number of EDAs appear larger, masking a hidden trend of declining activity.
With this understanding, we can re-interpret Chart 1.2.1 as follows:
- The apparent growth from 2007 and 2010 was not real growth, but almost entirely an increase in paper EDAs. In fact, by 2010, the number of financially active Green Party EDAs had already fallen from 40% of ridings to only 34% of ridings.
- The apparent overall loss of only 5–6% ridings with EDAs from 2007–2017 was, in fact, a loss of 27% of ridings with financially active EDAs.
The real situation at the year-end of 2017 is as follows: out of the 338 ridings in Canada, 281 of these ridings had no local Green Party financial activity whatsoever, and only 10 of these ridings had an EDA with more than 10 contributors—the lowest year on record.
Chart 1.2.3 below gives another perspective on the phenomenon of paper EDAs in the Green Party. For each year, it shows the percentage of existing EDAs that had zero, 1–10, or more than 10 contributors. Viewing this data as a percentage factors out any changes in the total number of EDAs, allowing us to focus on the changing level of financial activity within existing EDAs.
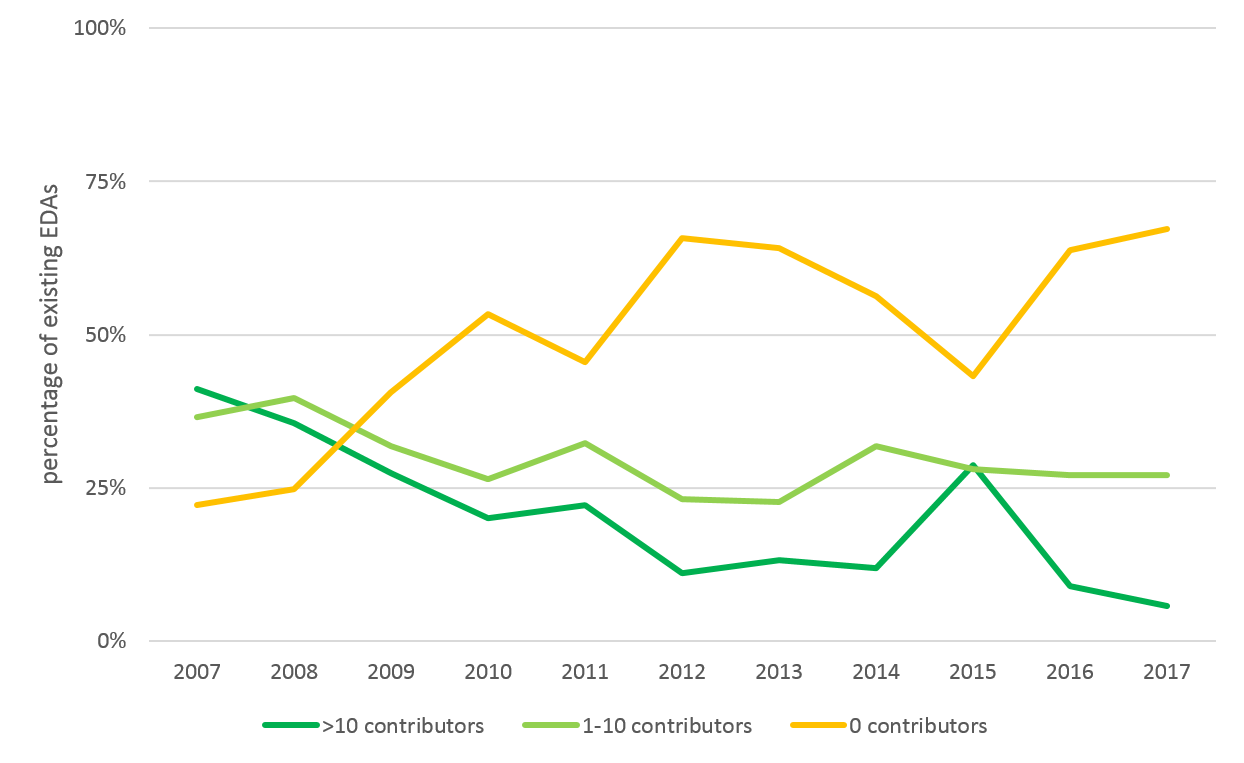
The percentage of Green Party EDA’s with more than 10 contributors has declined sharply, from 41% in 2007 to only 6% in 2017, the lowest year on record.
The percentage of Green Party EDA’s with no contributors has increased sharply, from 22% in 2007 to 67% in 2017, the highest year on record. Even during the critical election year of 2015, four out of ten GPC EDAs did not take in a single contribution for the whole year.
These ratios expose the fact that, in addition to the total number of contributors to GPC EDAs being at a historic low (as shown in Part 1.1), that shrinking number of contributors are giving to a smaller percentage of a shrinking group of EDAs—a triple decline.
Comparing the percentage of paper EDAs to other parties
Chart 1.2.4 below compares the percentage of GPC paper EDAs versus the percentage across the other four major parties.
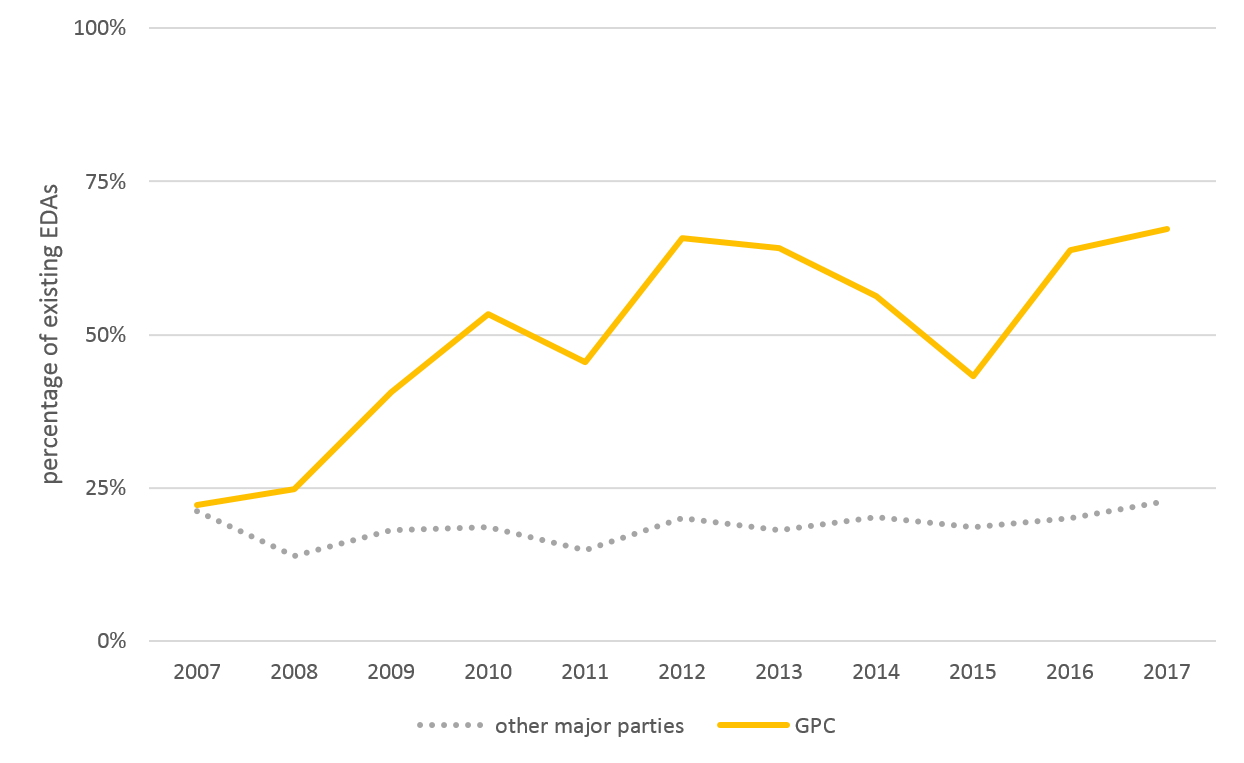
All parties have some paper EDAs. However, the other four major parties have maintained an average of around 20% paper EDAs over the past decade, while the GPC has seen its ratio grow from 22% to 67% over that time.
Each other party’s ratio has, at times, risen or fallen by up to 10 percentage points. However, at no point in Elections Canada’s records has any other major party experienced an increase in paper EDAs as long-lasting and as large as the GPC’s ten-year trend.
Nor has any other major party had a ratio of paper EDAs as high as the GPC in any given year of Elections Canada’s records, with one exception: the Bloc Québécois, in the middle of their crisis in 2015, hit a peak of 48% paper EDAs, only 5% more than the GPC’s 43% in that same year. (The BQ’s ratio then went back down, while the GPC’s continued to climb.)
One other trend that is visible in Chart 1.2.4 is the habit of some GPC EDAs to “wake up” during election years only, with clear dips in the ratio of paper EDAs visible in election years 2011 and 2015. Other major parties sometimes experience this phenomenon, but not in all elections, and rarely to the degree visible in the GPC. These “election-only EDAs” are primarily a GPC phenomenon.
A category-by-category look at GPC EDA activity across Canada
Chart 1.2.5 below classifies each of Canada’s ridings into one of five categories according to GPC EDA activity in that riding, then compares those categories between the years 2007 and 2017. This gives us an overall picture of the change in GPC EDA activity across the country over the past decade.
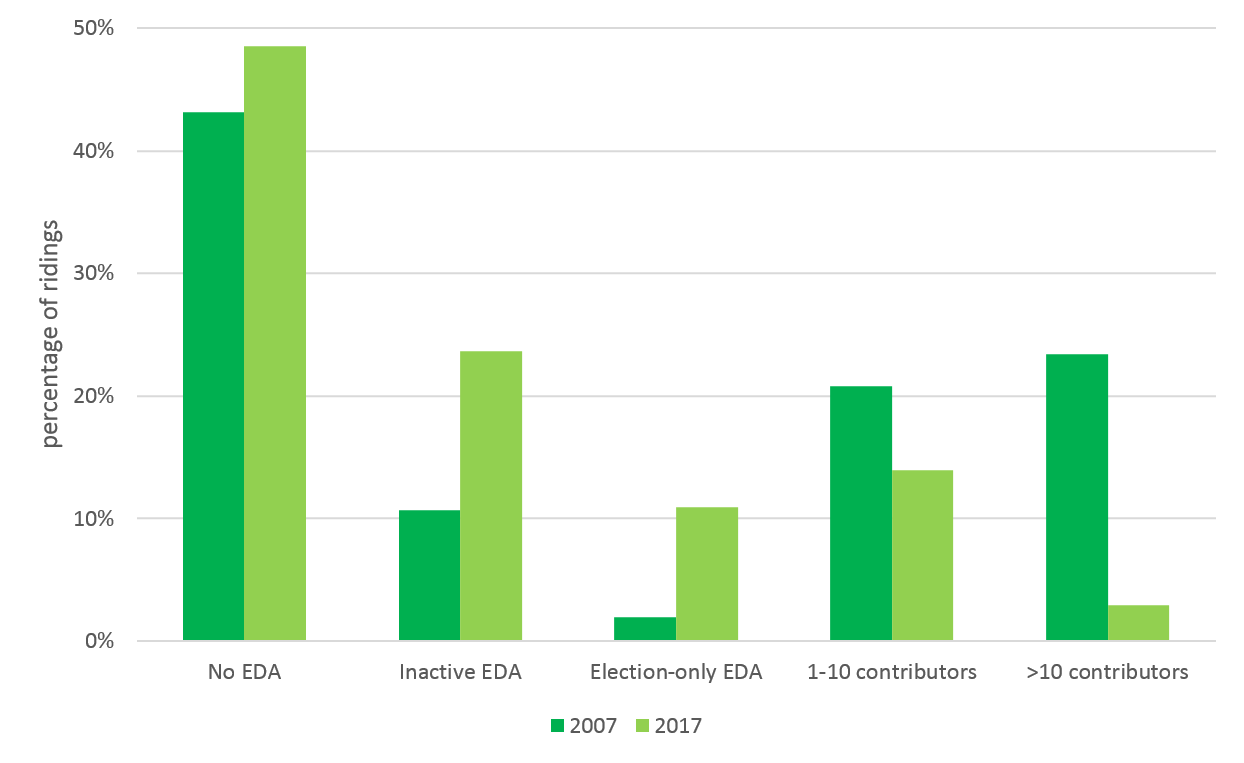
The percentage of ridings with no GPC EDA has increased from 43% to 49%, and the percentage of ridings with a completely inactive “paper” EDA has increased from 11% to 24%. Taken together, there was an increase from 54% to 72% of ridings with no GPC EDA activity at all.
The percentage of ridings with an “election-only” EDA, meaning an EDA that is currently inactive, but had received at least one contribution in the most recent election year, has increased from 2% to 11%.
The percentage of ridings with an EDA having 1-10 contributors has declined from 21% to 14%, and the percentage of ridings with an EDA having more than 10 contributors has declined from 23% to 3%. Taken together, there was a decline from 44% to 17% of ridings having a GPC EDA with ongoing financial activity.
The loss of well-established EDAs
In Chart 1.2.1, we saw that there had been a 5–6% decline in the percentage of ridings with a GPC EDA. This invites another question: are the EDAs that exist in 2017 the same ones that existed in 2007? Or, phrased differently, is the GPC maintaining a stable core of EDAs, or is that core being eroded over time?
Chart 1.2.6 below answers this question by counting the number of EDAs that were established in 2007 or earlier, and examining how many continue to exist in subsequent years. As with the earlier Chart 1.2.2, the number of contributors is also indicated.
Important: The riding boundary changes of 2015 create a discontinuity in the data. Some ridings retained the same boundaries before and after the redistribution, while other ridings were split, grew, shrank, or were absorbed into others. This makes it impossible to compare EDAs across the 2014-2015 boundary.
Instead, best-case and worst-case scenarios are given for the period 2007-2017 by assuming that the apparent “losses” in 2015 are either all real, or all a result of ridings being renamed. The reality lies somewhere in between these extremes.
(Aside: The Canada Gazette, which announces EDA de-registrations, shows that the GPC’s transition through 2015 was not entirely orderly. Whereas other major parties voluntarily de-registered EDAs in the old ridings and replaced them with new EDAs in the new ridings, many GPC EDAs were involuntarily de-registered for failing to provide financial returns. This suggests that for at least some GPC EDAs, their local support was no longer sufficient to maintain operations when redistribution occurred, meaning that at least some of the losses in 2015 are real. However, other EDAs can be confirmed to have transitioned to new ridings with new names, meaning that another portion of the losses are false. A complete survey of the fates of individual ridings is outside the scope of this report.)
In 2007, there were 175 GPC EDAs. By 2014, the party had lost 65 of those early EDAs, or 37%. These losses happened steadily, with losses of about 5% each year. This pattern of steady losses suggests a chronic problem with turnover—EDAs being lost in established ridings, even as new ones might be registered in other ridings.
Taking into account the best-case and worst-case scenarios for the losses in 2015, the total loss from 2007-2017 is at minimum 41% and at maximum 71% of the EDAs that were formed in 2007 or earlier.
By comparison, the Liberals, Conservatives, and NDP lost only 2–4% of their EDAs over the same period. This suggests that a turnover rate of 2–4% per decade is the norm for the largest parties, compared to the 41–71% turnover experienced by the GPC.
These numbers also help to further clarify what happened during the apparent “growth period” from 2007 to 2010. Looking only at Chart 1.2.1, one might theorize that the party had attempted to grow outward from a well-established base, failed, and fallen back to that well-established base.
Chart 1.2.6 proves this is not the case. Even as the apparent “expansion” was happening from 2007–2010, the established base of EDAs was already being eroded, and has continued to erode every year following.
Well-established EDAs falling dormant
Earlier, Chart 1.2.3 and Chart 1.2.4 showed a steep increase in the percentage of paper EDAs. Based on those charts, one might wonder whether this trend was confined to younger EDAs, while well-established EDAs maintained a healthy level of activity.
Chart 1.2.7 below answers this question by showing the percentage of long-established EDAs with zero, 1–10, and more than ten contributors.
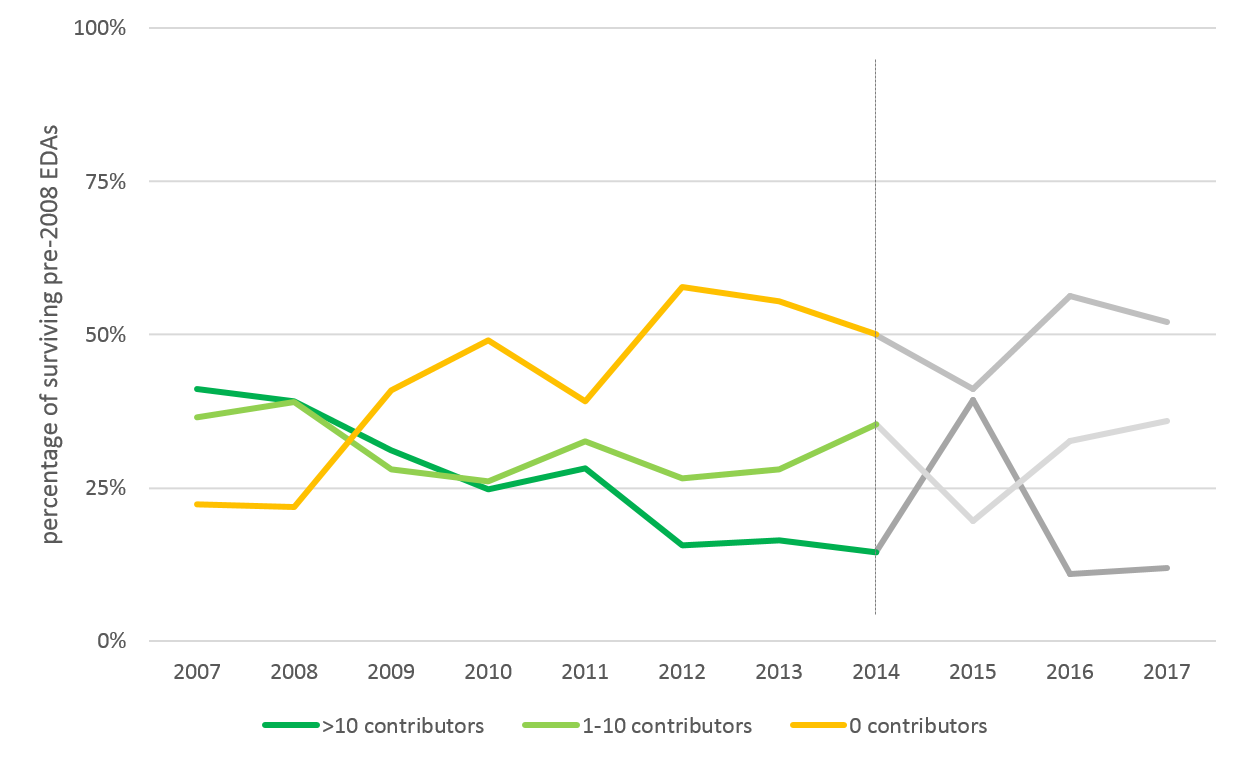
Again, the riding boundary changes in 2015 affect this chart. The percentages shown for 2015–2017 include only the subset of EDAs which continued to operate under the same name as they had used prior to 2014. This reduces the sample size in the years 2015–2017 from around 120 EDAs to around 60 EDAs. It is impossible to say how the included and excluded EDAs might differ, and therefore impossible to say whether the data from 2015–2017 is directly comparable to 2007–2014. As a result, the analysis in this section stops at 2014.
From 2007 to 2014, the percentage of well-established EDAs with more than ten contributors fell from 41% to 15%, and the percentage with no contributors rose from 22% to 50%.
Both of these trends are only slightly less severe than what was experienced by the rest of the party’s EDAs from 2007 to 2014. This suggests that the increase of paper EDAs and the decline of financial activity are not “fringe” phenomenons restricted to younger EDAs, but rather, trends that affected even the most well-established EDAs of the party.
In absolute terms, the number of active, well-established GPC EDAs has fallen from 136 in 2007 to 55 in 2014, a loss of 60% in only seven years.
Summary
From 2007 to 2017, the GPC has failed to increase its EDA presence beyond 50–55% of ridings nationally, while the other major parties maintain an ongoing 99–100% presence.
An apparent growth period in 2007–2010 was, in fact, an illusion created by an increase in the number of financially inactive “paper” EDAs. During this time the number of financially active EDAs actually declined.
The increase in the percentage of paper EDAs has continued throughout the decade, reaching 67% in 2017, far higher than the 20% ratio that is typical in other major parties.
Dividing ridings into categories and comparing 2007 to 2017 shows an increase in the percentage of ridings with no GPC EDA, a paper EDA, or an election-only EDA. The percentage of ridings with a financially active GPC EDA has declined severely, with 2017 the worst year on record.
Between 41–71% of well-established EDAs have been lost since 2007, compared to only 2–4% in the three largest parties. The well-established EDAs that survive have become less financially active, with half of them being only paper EDAs by 2014.
Overall, the GPC has seen an ongoing decline in the number, activity, and longevity of its EDAs. As a result, the party as of 2017 has fewer well-established, financially-active EDAs supporting it at the local level than it did in 2007.
Coming next
The next part of this report will examine the internal financial health of GPC EDAs, including the drastically smaller local reserves available for the 2019 election, along with negative changes in the type and amount of local spending. Subsequent parts will examine regionalization of the party’s support base, a decline in internal participation, and the expected electoral consequences of these trends.
(SB: In the end, I did not publish any more sections of Decade of Decline. However, from time-to-time I continued to report on the fortunes and misfortunes of the GPC. Those posts are all available under the heading Dead on the Vine.)

Leave a comment